What is Load Testing and Why Does It Matter?
Website speed and stability directly affect user experience, conversions, and SEO rankings. If your website becomes slow during traffic spikes, users may leave before completing purchases or filling out forms.Load testing is a type of performance testing that checks how your website or application behaves when multiple users access it at the same time. It helps identify server bottlenecks, slow APIs, database issues, and scalability problems before they impact real customers.
In this guide, we will explain load testing in detail, how Apache JMeter works, common performance problems, best practices, and why tools like K6 are becoming popular for modern testing workflows.

Understanding Website Performance Problems
Many businesses focus heavily on design and features but ignore performance testing. A website may work perfectly with 5 users, but problems can appear when hundreds or thousands of visitors use it simultaneously.
This becomes especially important during sales campaigns, product launches, festive offers, or high-traffic events. If your server cannot handle user traffic properly, your website may slow down or even crash completely.
A slow website not only frustrates users but can also reduce SEO rankings, increase bounce rate, and decrease sales conversions.
Common Performance Issues
Professional Load Testing Services with K6 & JMeter
Slow websites and unstable APIs can affect user experience, sales, SEO rankings, and customer trust. That's why load testing is important before launching any website or application.
Our main focus is K6 because it is modern, fast, lightweight, and perfect for cloud-based applications, APIs, and DevOps workflows. K6 helps us test how your application performs when many users visit at the same time.
We also use Apache JMeter for enterprise systems and traditional performance testing projects where JMeter is still widely used and important.
Why We Use K6 for Modern Load Testing
K6 is one of the best modern performance testing tools. It is easy to automate, works well with CI/CD pipelines, and supports cloud-native applications.
K6 Benefits
K6 is fast, lightweight, developer-friendly, and great for testing APIs, websites, cloud systems, and modern applications.
- Lightweight and high-performance — uses Go under the hood for minimal resource consumption
- Developer-friendly scripting using JavaScript (ES6+)
- Seamless CI/CD integration with GitHub Actions, GitLab CI, Jenkins, and more
- Native support for cloud-native and microservices architectures
- Built-in metrics and beautiful HTML reports out of the box
- Open source with an active community and K6 Cloud option for scaled testing
K6 Key Features
K6 Test Script — How It Looks
One of K6's biggest advantages is how clean and readable its test scripts are. Written in JavaScript, they are easy for any developer to understand, modify, and maintain.
import { check, sleep } from 'k6';
// Define load test options
export const options = {
stages: [
{ duration: '30s', target: 20 }, // ramp up to 20 users
{ duration: '1m', target: 50 }, // hold at 50 users
{ duration: '30s', target: 0 }, // ramp down
],
thresholds: {
'http_req_duration': ['p(95)<2000'], // 95% under 2s
'http_req_failed': ['rate<0.01'], // <1% error rate
},
};
// Main test function — runs for each virtual user
export default function () {
const res = http.get('https://yourwebsite.com/api/products');
check(res, {
'status is 200': (r) => r.status === 200,
'response time OK': (r) => r.timings.duration < 2000,
});
sleep(1);
}
K6 Test Types We Use
| Test Type | Purpose | K6 Stage Config |
|---|---|---|
| Smoke Test | Verify the system works under minimal load | 1–2 VUs for a short duration |
| Load Test | Test normal and peak expected traffic | Gradual ramp-up to target VUs |
| Stress Test | Push beyond limits to find breaking points | High VU count beyond capacity |
| Spike Test | Sudden traffic bursts like flash sales | Instant ramp to peak, then drop |
| Soak Test | Sustained load over long duration for memory leaks | Steady VUs for hours |
K6 Testing Workflow We Follow
Our K6 testing process is structured and iterative, designed to give you clear insights at every stage.
Understand your endpoints, expected user flows, and SLO targets (response time, error rate thresholds).
Write modular JavaScript test scripts with realistic user scenarios, parameterized data, and custom checks.
Run with 1–2 VUs first to confirm the script works correctly and collect baseline performance numbers.
Execute load, stress, and spike tests with configured stages. Monitor live metrics using K6 output.
Generate detailed K6 HTML reports with threshold results, trends, and per-endpoint breakdown.
Deliver actionable findings: bottlenecks, slow queries, caching opportunities, and infrastructure tuning.
Our K6 Load Testing Services
We offer comprehensive K6 load testing solutions tailored for modern web applications, APIs, and cloud-based systems.
Simulate real-world traffic and measure how your website performs under heavy user load.
Test REST and GraphQL APIs for response time, throughput, and reliability under concurrent requests.
Push your application beyond normal limits to find breaking points and failure thresholds.
Run distributed load tests from multiple cloud regions to simulate global traffic patterns.
Verify that your system scales correctly as user numbers grow from hundreds to thousands.
We Can Also View a Proper Report Related to Load Testing in K6
K6 generates a clean, detailed HTML report after every test run. It shows key performance metrics, request details, virtual user behaviour, and threshold results — all in one place.
Test Report: 2026-05-29 11:05
Trends & Times
| AVG | MIN | MED | MAX | P(90) | P(95) | |
|---|---|---|---|---|---|---|
| http_req_blocked | 236.17 | 0.00 | 0.00 | 551.53 | 551.53 | 551.53 |
| http_req_connecting | 112.10 | 0.00 | 0.00 | 261.79 | 261.59 | 261.69 |
| http_req_duration | 3479.89 | 1043.35 | 1965.07 | 9438.78 | 7902.75 | 8670.77 |
| http_req_receiving | 2936.98 | 521.18 | 1405.82 | 8905.34 | 7388.89 | 8147.11 |
| http_req_sending | 0.43 | 0.00 | 0.60 | 0.62 | 0.62 | 0.62 |
| http_req_tls_handshaking | 123.31 | 0.00 | 0.00 | 287.73 | 287.73 | 287.73 |
Other Checks
| Check Name | Passes | Failures | % Pass |
|---|---|---|---|
| check status code 200 | 7 | 0 | 100.00 |
Problems We Help You Solve
Many websites and applications work fine with a few users but become slow or crash when traffic increases. Our load testing services help identify these problems before they affect your real customers.
Prevent crashes during sales, campaigns, or sudden traffic spikes before they cost you customers.
Improve slow backend APIs and reduce response time to keep your application fast and reliable.
Identify slow database queries and performance bottlenecks before they impact real users.
Reduce downtime and improve application stability so your users always get a seamless experience.
Why We Also Use Apache JMeter
While K6 is our main focus, JMeter is still important for enterprise applications and traditional testing projects. Many companies already use JMeter, so we also support it based on project needs.
JMeter works well for protocol testing, enterprise systems, and older environments where traditional load testing is required.
| Feature | K6 | JMeter |
|---|---|---|
| Modern Applications | ✦ Excellent | Good |
| CI/CD Integration | ✦ Excellent | Moderate |
| Cloud Testing | ✦ Optimized | Limited |
| Enterprise Testing | Good | ✦ Excellent |
| Resource Usage | ✦ Lightweight | Higher |
Our Load Testing Process
We follow a structured, step-by-step approach to ensure every test delivers accurate insights and actionable results for your application.
Project Analysis
We understand your website, API, and traffic requirements to plan the right testing strategy.
Test Planning
We create realistic traffic and user testing scenarios that reflect your actual production environment.
Script Creation
We create optimized K6 and JMeter testing scripts tailored to your application's workflows.
Load Testing
We run performance tests and monitor application behavior under simulated traffic conditions.
Optimization Report
We provide detailed reports and actionable suggestions to improve performance and stability.
What is Apache JMeter?
Apache JMeter is one of the most widely used load testing tools. It allows testers and developers to simulate multiple users and measure how web applications perform under different levels of traffic.
JMeter supports websites, APIs, databases, FTP servers, and many other protocols. It is commonly used by QA engineers, developers, and DevOps teams to analyze performance and identify scalability issues.
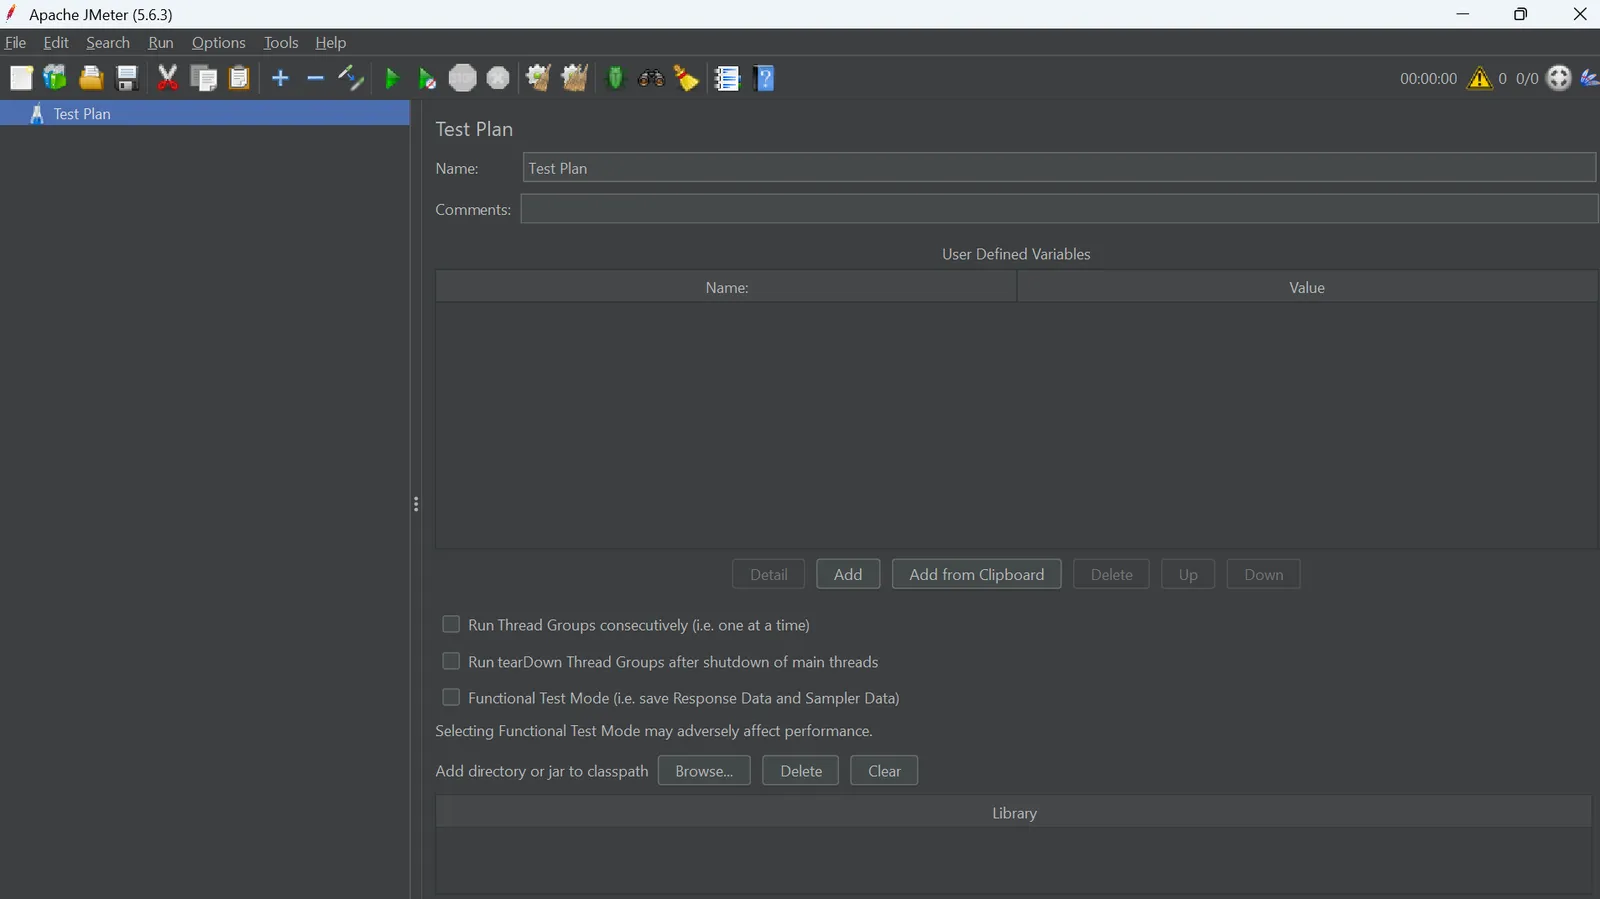 JMeter Interface — Test Plan Overview
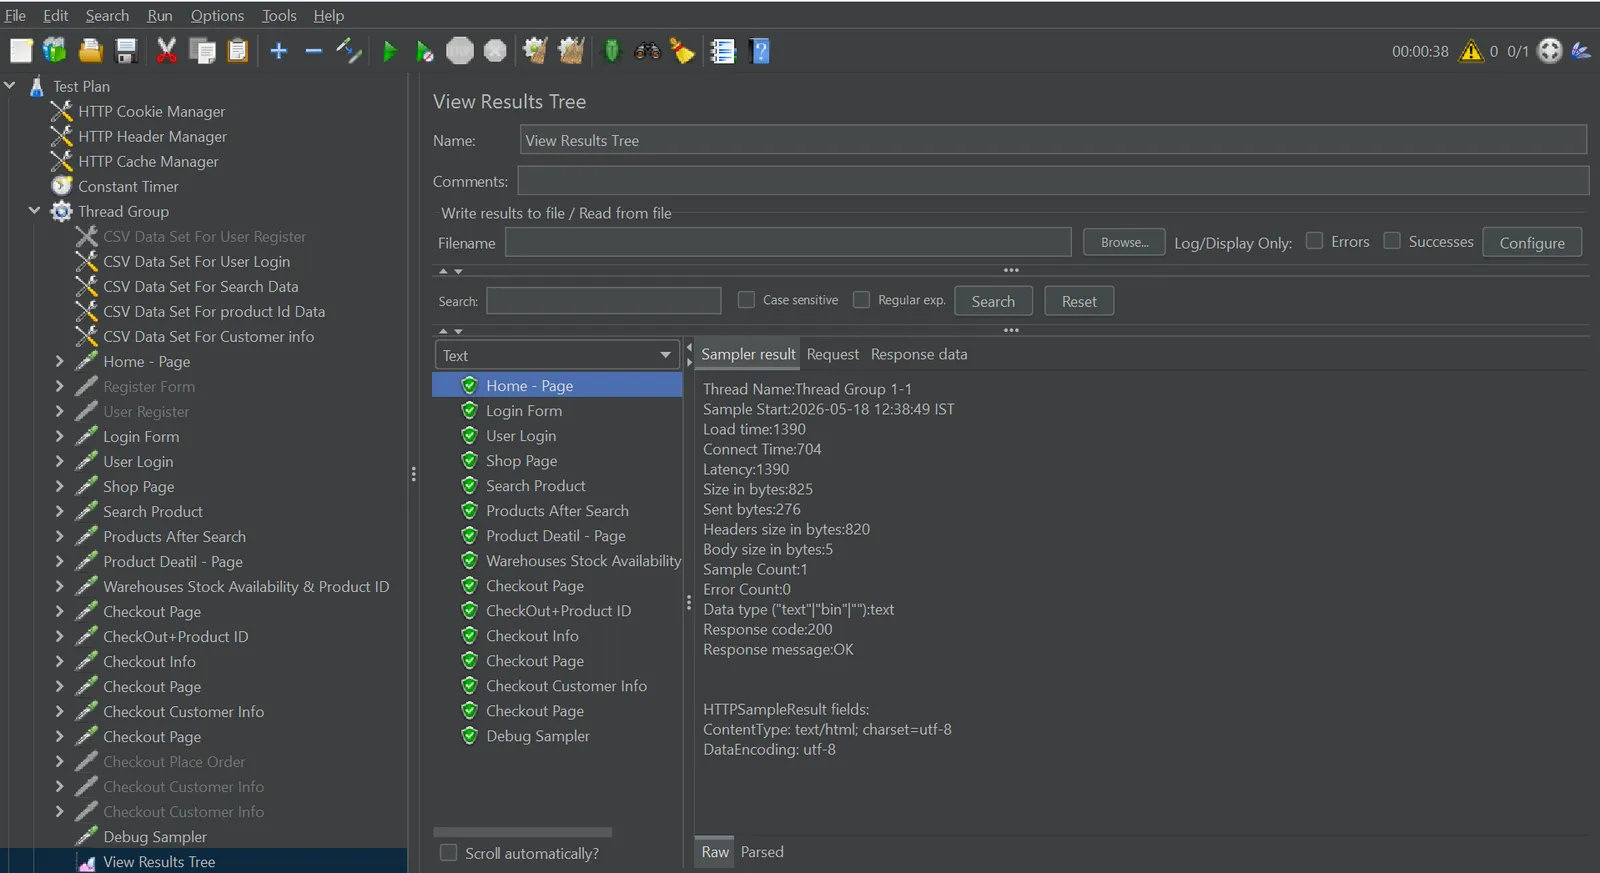 Response Time & Throughput Analytics
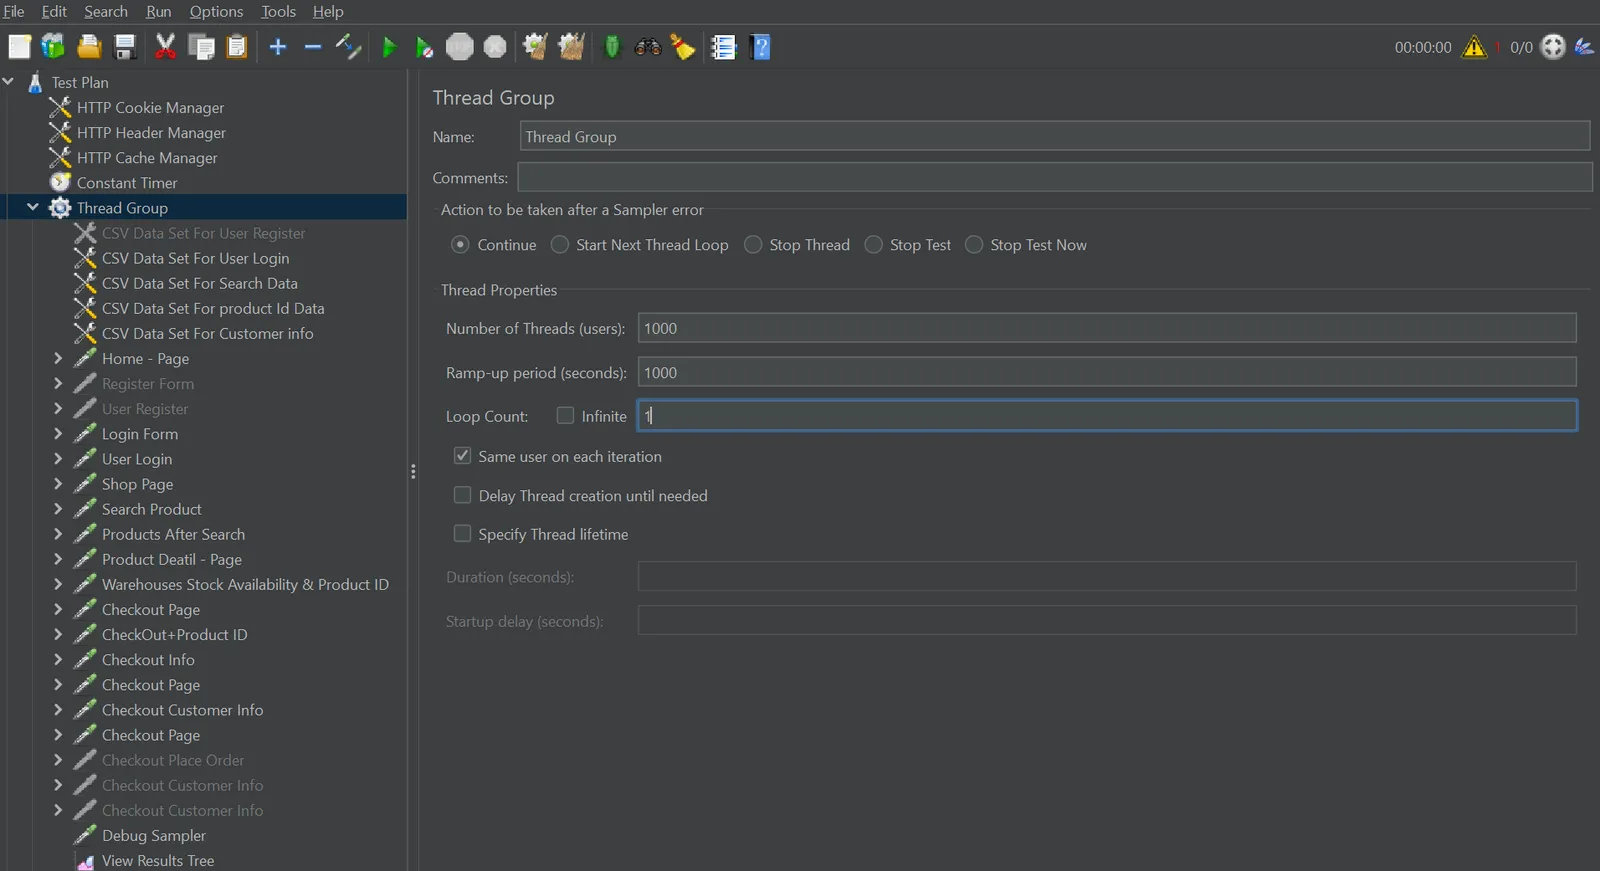 Server Monitoring — Virtual Users Simulation
Why Developers Use JMeter
Create test plans using a graphical interface without complex setup.
Analyze response time, throughput, latency, and error percentage.
Supports REST APIs, SOAP services, and backend performance testing.
Simulate thousands of virtual users for stress and load testing.
How Load Testing Works in JMeter
A typical load testing workflow starts with creating a test plan. In JMeter, testers define the number of users, requests, test duration, and target URLs.
JMeter then sends virtual traffic to the application and collects performance data. This data helps identify where the application becomes slow or unstable.
| Testing Step | Description |
|---|---|
| Create Test Plan | Define target URLs, APIs, and user scenarios. |
| Configure Threads | Set the number of virtual users and ramp-up time. |
| Add Listeners | Collect metrics like response time and throughput. |
| Run the Test | Simulate real-world traffic conditions. |
| Analyze Reports | Identify bottlenecks, errors, and server limitations. |
Important Load Testing Metrics You Should Monitor
Understanding performance metrics is critical during load testing. These metrics help developers and testers evaluate how efficiently the application handles traffic.
The total time taken by the server to respond to a request.
The number of requests processed per second or minute.
Percentage of failed requests during the testing process.
Number of users accessing the system simultaneously.
Google considers page speed and user experience as important ranking factors. Better performance can improve SEO visibility and conversions.
Chart-Format Load Testing Reports
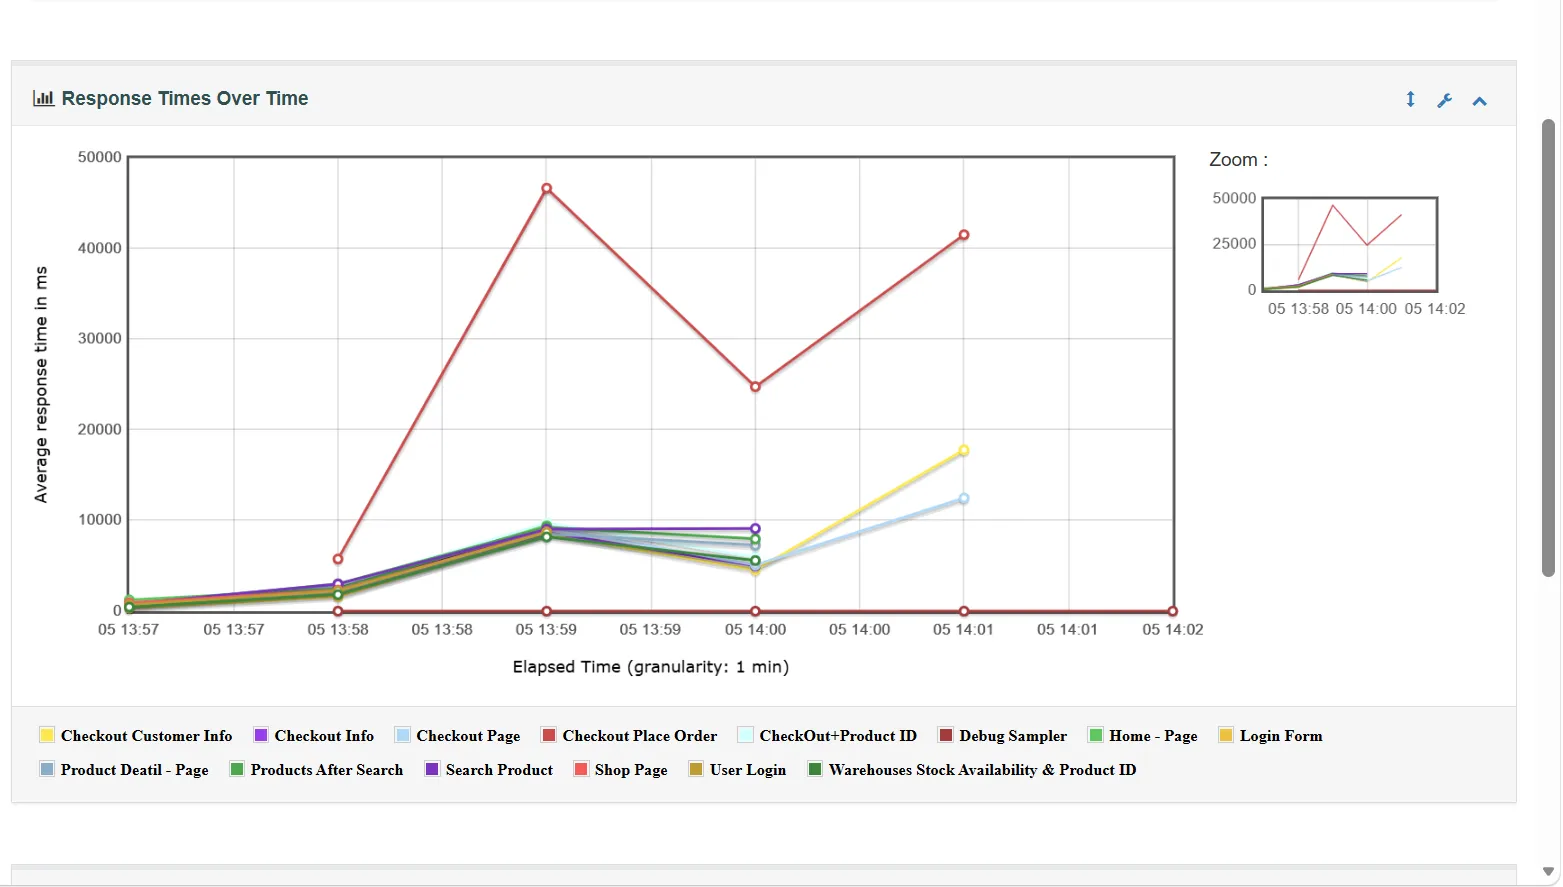 Dashboard Summary Report
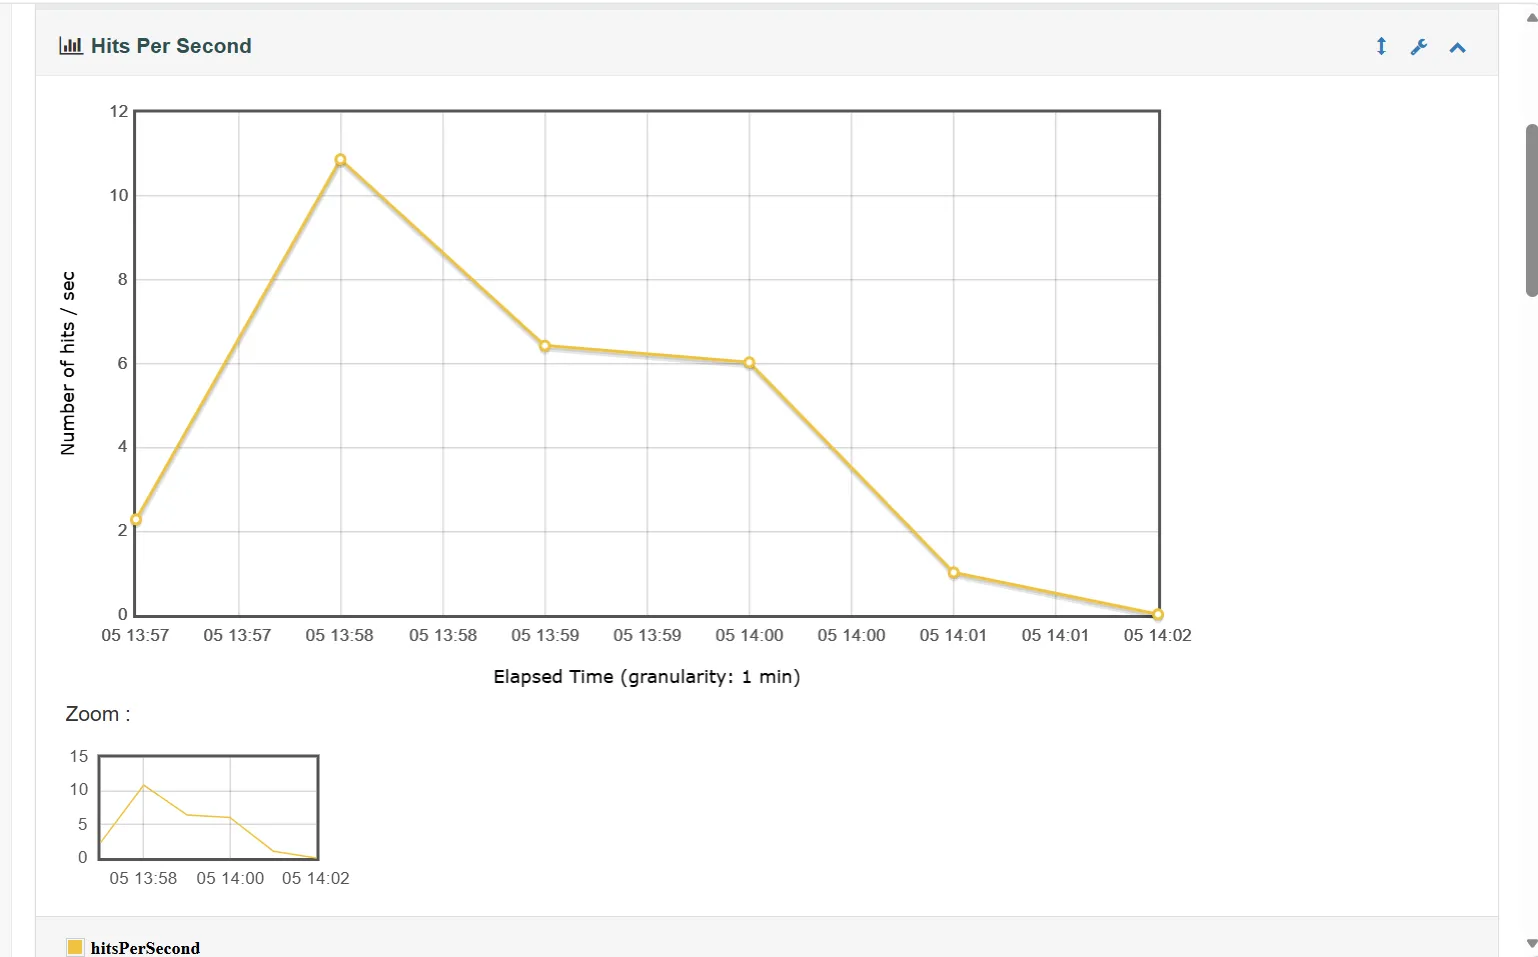 Performance Overview Chart
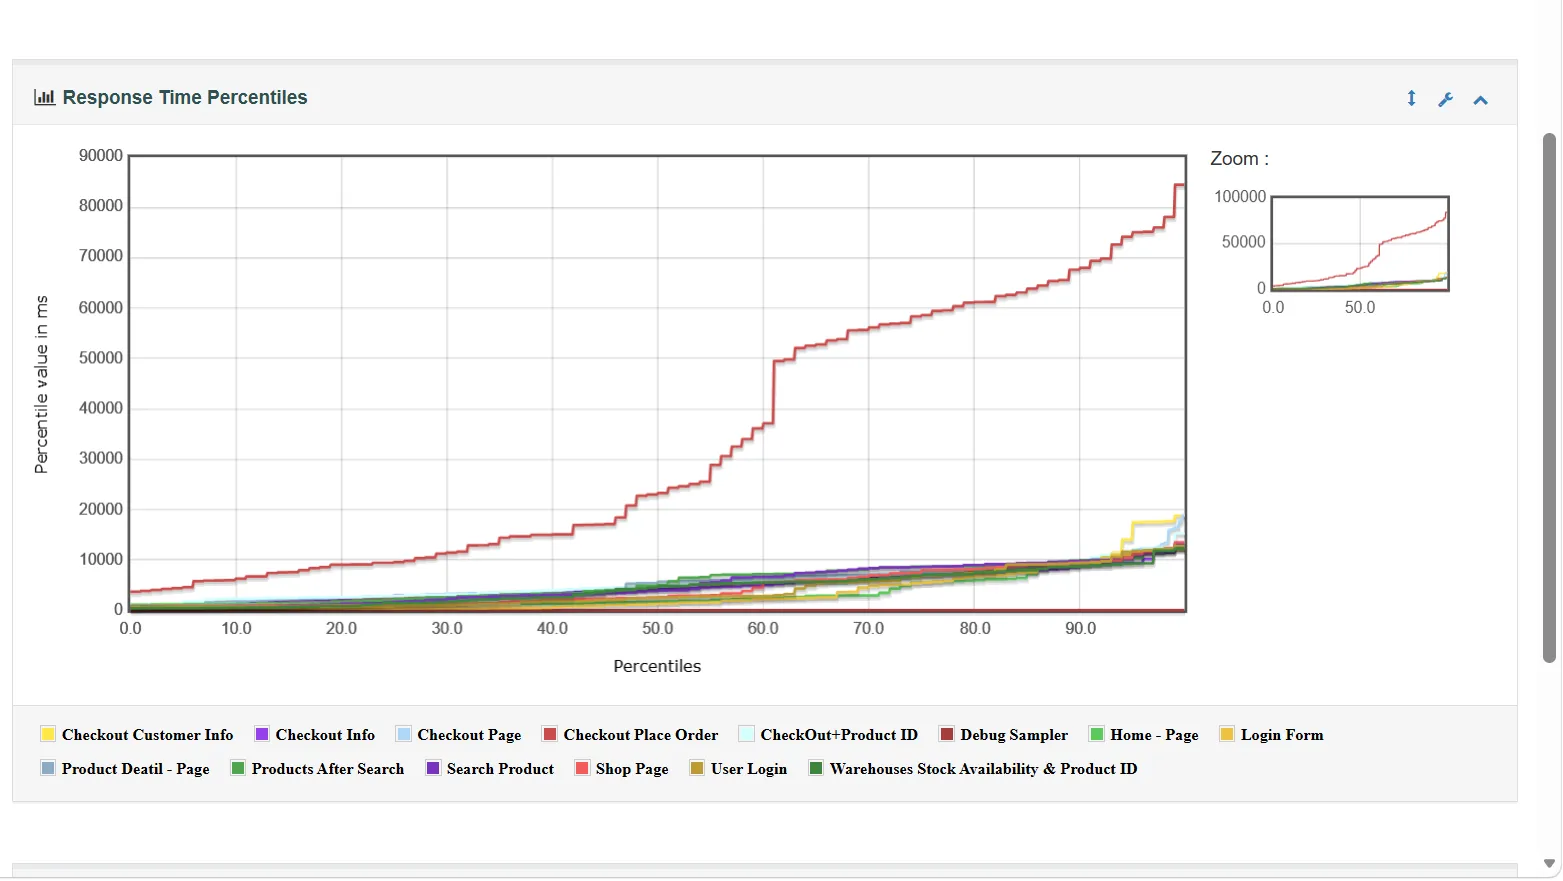 Response Time Analysis
Response Times Over Time, Response Time Percentiles Over Time, Active Threads Over Time, Bytes Throughput Over Time, Latencies Over Time, and Connect Time Over Time.
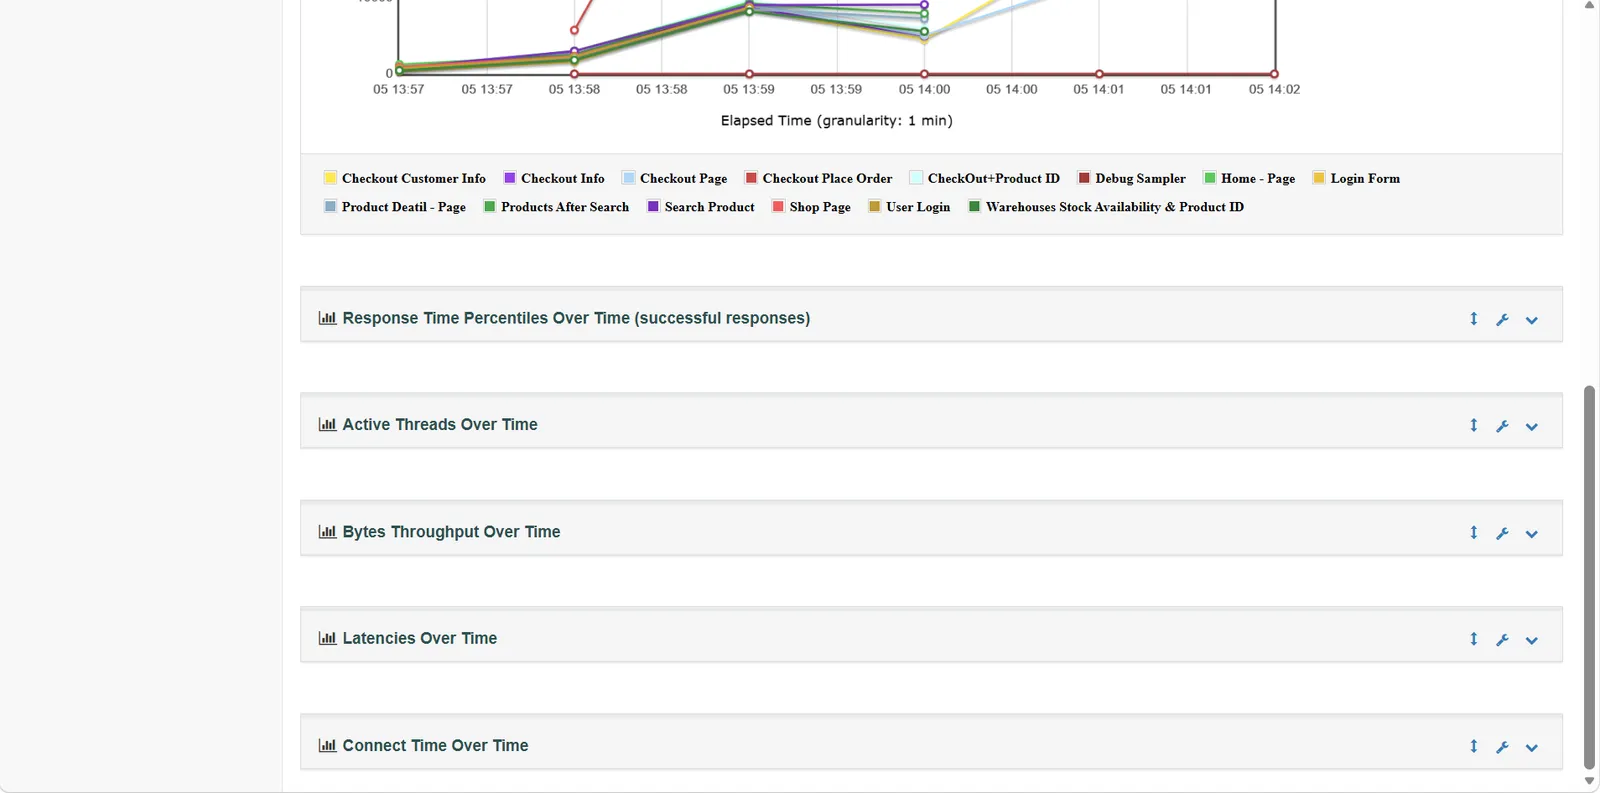 Over Time Chart — Threads & Latency
Hits Per Second, Codes Per Second, Transactions Per Second, Total Transactions Per Second, Response Time Vs Request, Latency Vs Request.
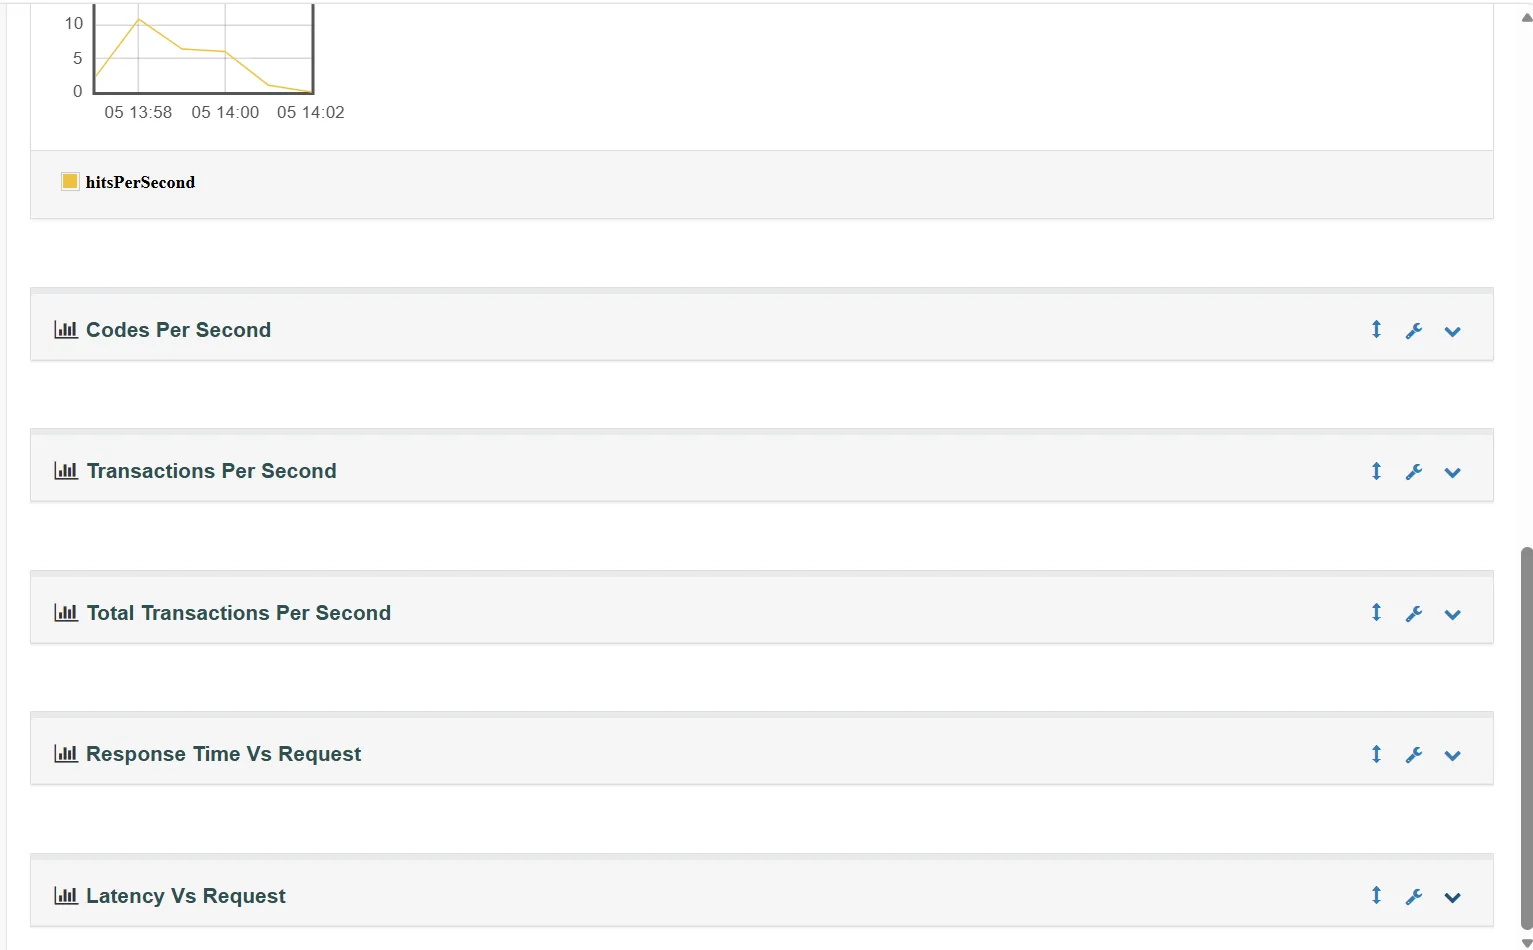 Throughput Chart — Hits & Transactions Per Second
Response Time Percentiles, Response Time Overview, Time Vs Threads, Response Time Distribution.
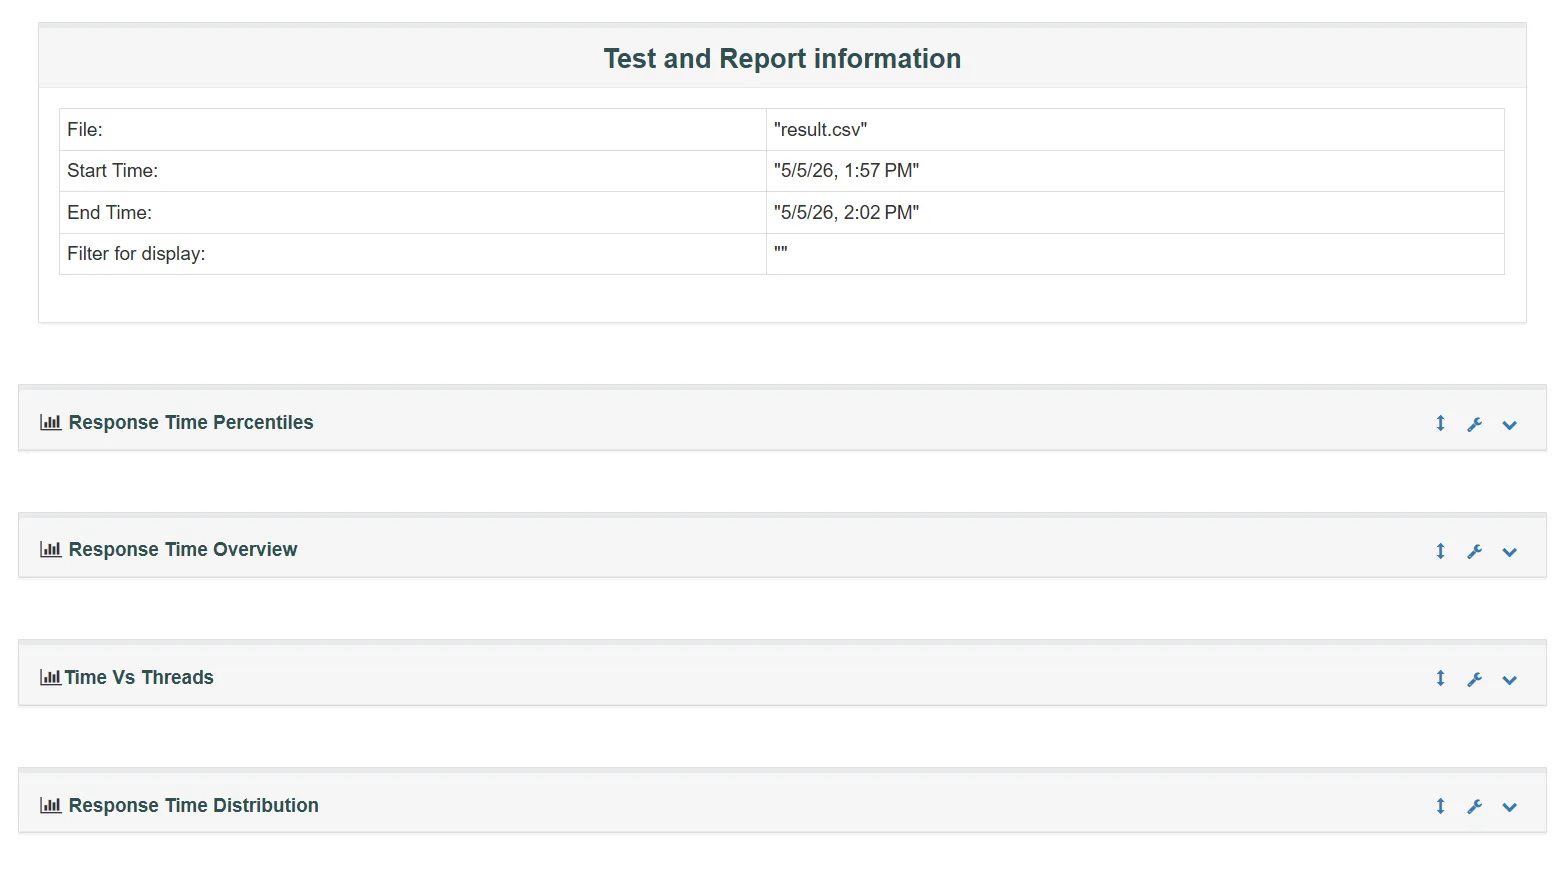 Response Time Distribution & Percentiles
What is APDEX?
APDEX (Application Performance Index) is a standard method used to measure user satisfaction based on application response time.
Instead of only checking whether requests passed or failed, APDEX helps measure:
- How satisfied users are with application speed
- Whether the website feels fast or slow to real users
- Overall application performance quality
APDEX Score Range
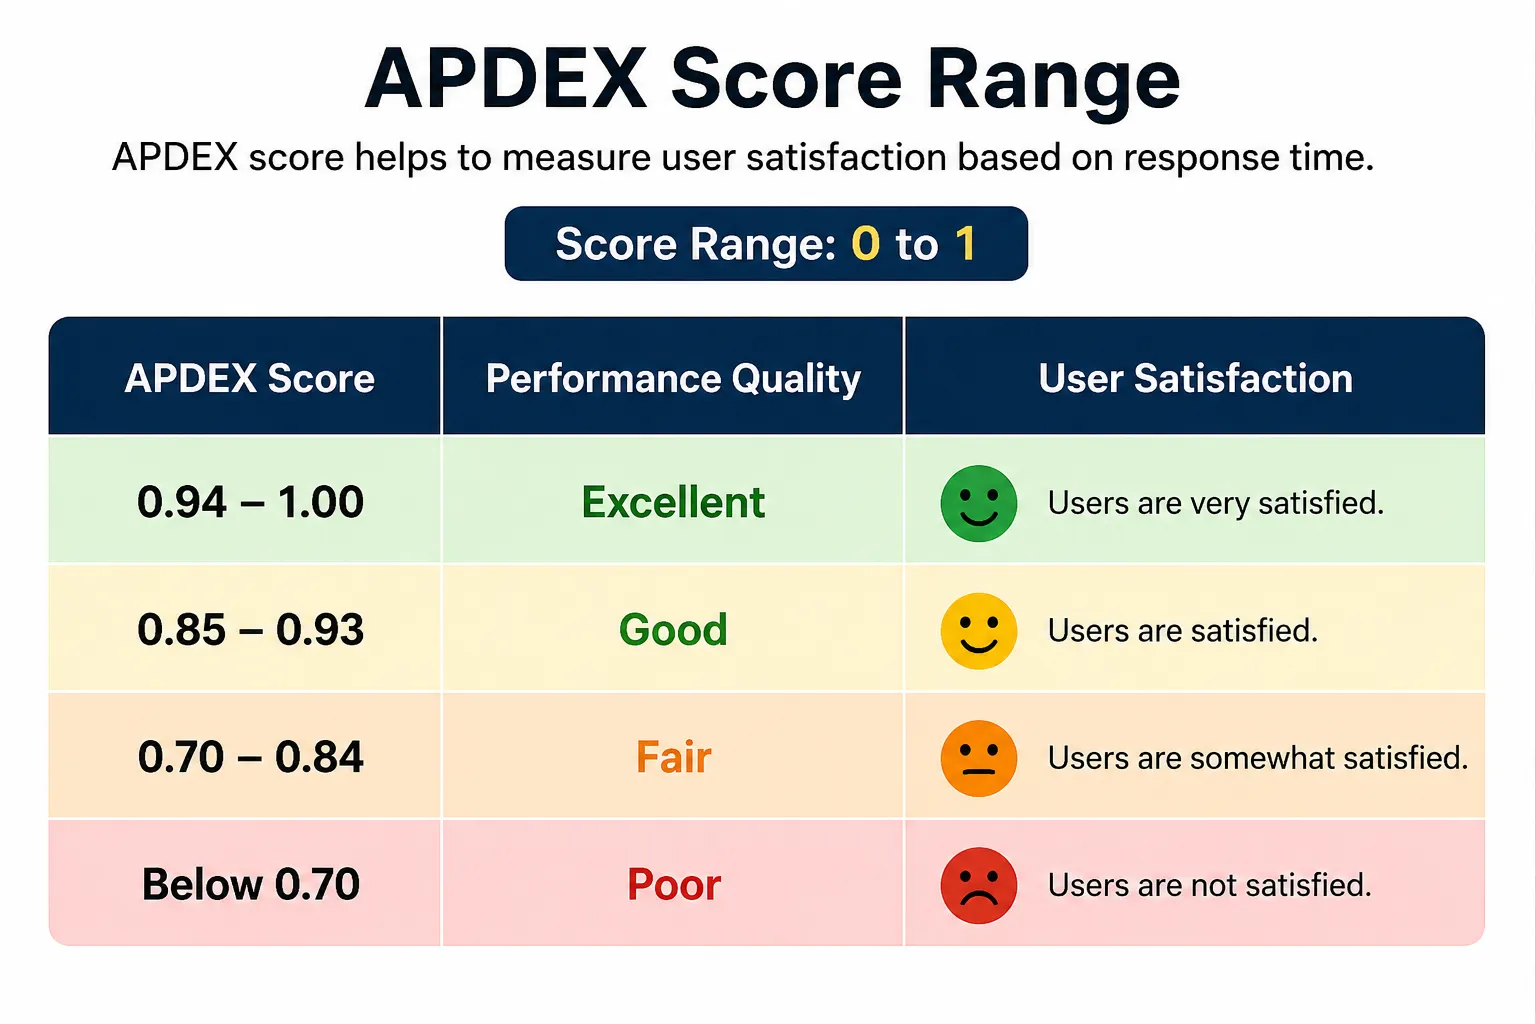 APDEX Score Range — Satisfied / Tolerating / Frustrated
APDEX Report View
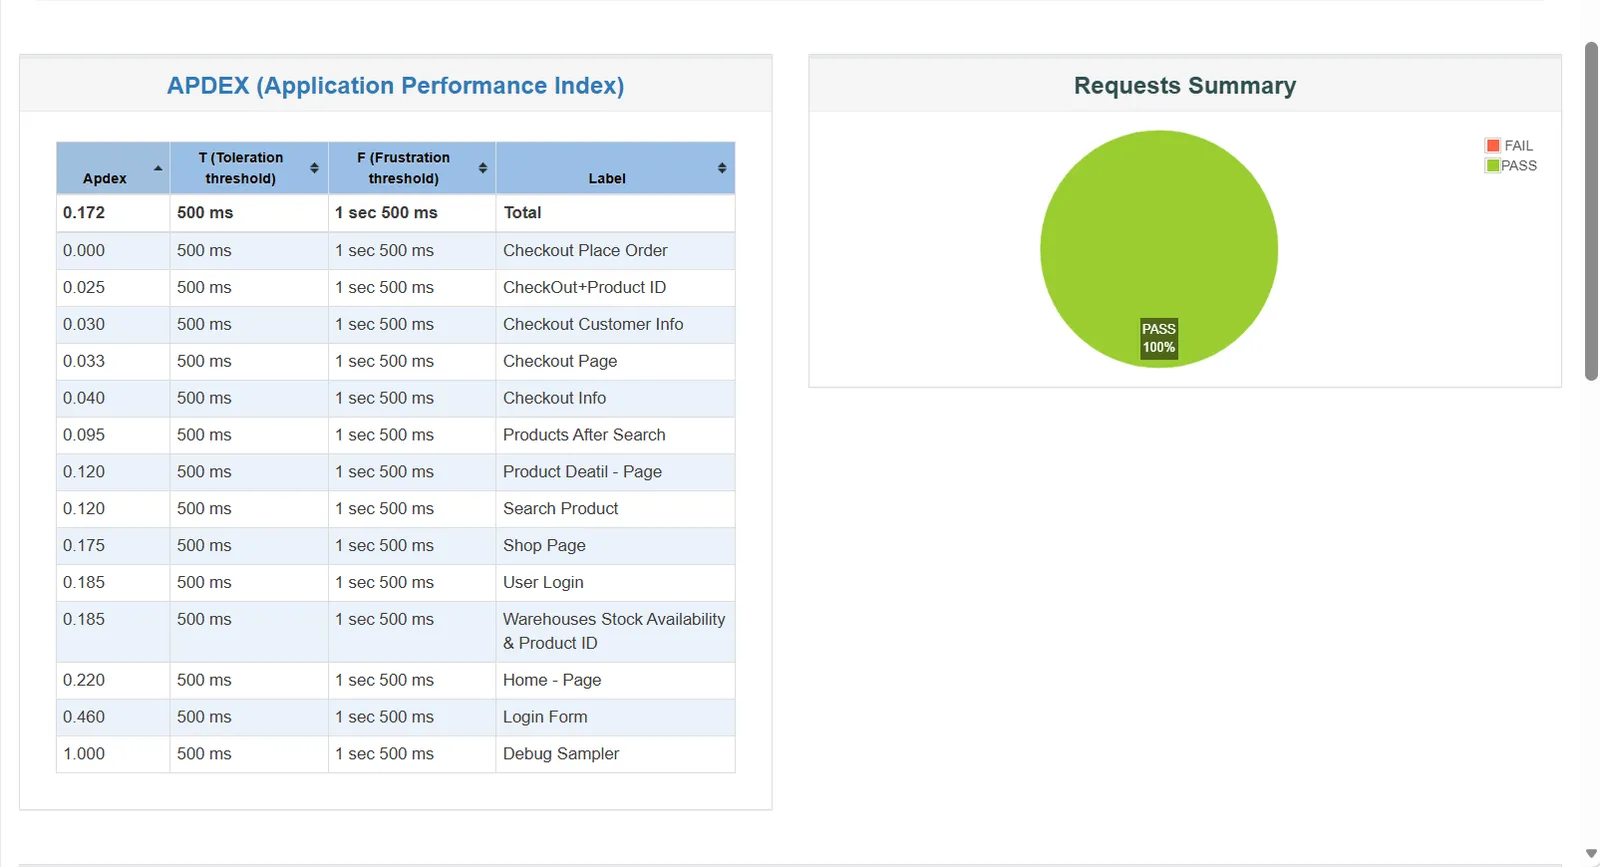 APDEX Report — Application Performance Index
Best Practices for Effective Load Testing
Recommended Practices
- Start testing early during development
- Test realistic user scenarios and workflows
- Monitor server CPU, RAM, and database usage
- Run tests regularly before major launches
- Analyze reports carefully instead of focusing only on speed
- Combine load testing with security and API testing
- Use cloud environments for large-scale simulations
- Optimize slow database queries and APIs
Common Mistakes
- Testing only homepage performance
- Ignoring mobile traffic behavior
- Running unrealistic traffic simulations
- Skipping backend monitoring during tests
- Using insufficient test data
- Ignoring failed requests and error logs
- Not testing third-party integrations
- Assuming good speed means good scalability
Real-World Example of Load Testing
Imagine an eCommerce website preparing for a festive sale campaign. Normally, the website receives around 200 visitors per hour, but during the sale, traffic increases to thousands of users within minutes.
Without proper load testing, the checkout process may slow down, payment APIs may fail, or the database may become overloaded. This can directly impact sales and customer trust.
Using JMeter, testers can simulate thousands of users browsing products, adding items to cart, and completing checkout. The results help developers optimize server configuration, caching, APIs, and database queries before the sale goes live.
Frequently Asked Questions
Need Professional Load Testing Services?
Improve your website performance, identify bottlenecks, and prepare your application for high traffic using professional load testing solutions with Apache JMeter and modern performance optimization techniques.